Goals: Complete an ultra distance, and avoid immune collapse before travel to Europe
- 2 x Zone 2 runs 1 x 50km ultra + 1 gym session
- Distance: 79.29 km (+26.62 km / 51%)
- Time: 9h 14min (+206 / 59%)
- Load: 441 (+110 / 33%)
- Calories: 6723 (+2030 / 43%)
- Elevation gain: 877m (+383m / 78%)
The goals were clear. This week was the only window to complete an ultra distance activity in January, and I needed to do it without blowing up my immune system ahead of a 24 transit from BC to Stockholm on Sunday. I got the first bit done, the jury’s out on the second.
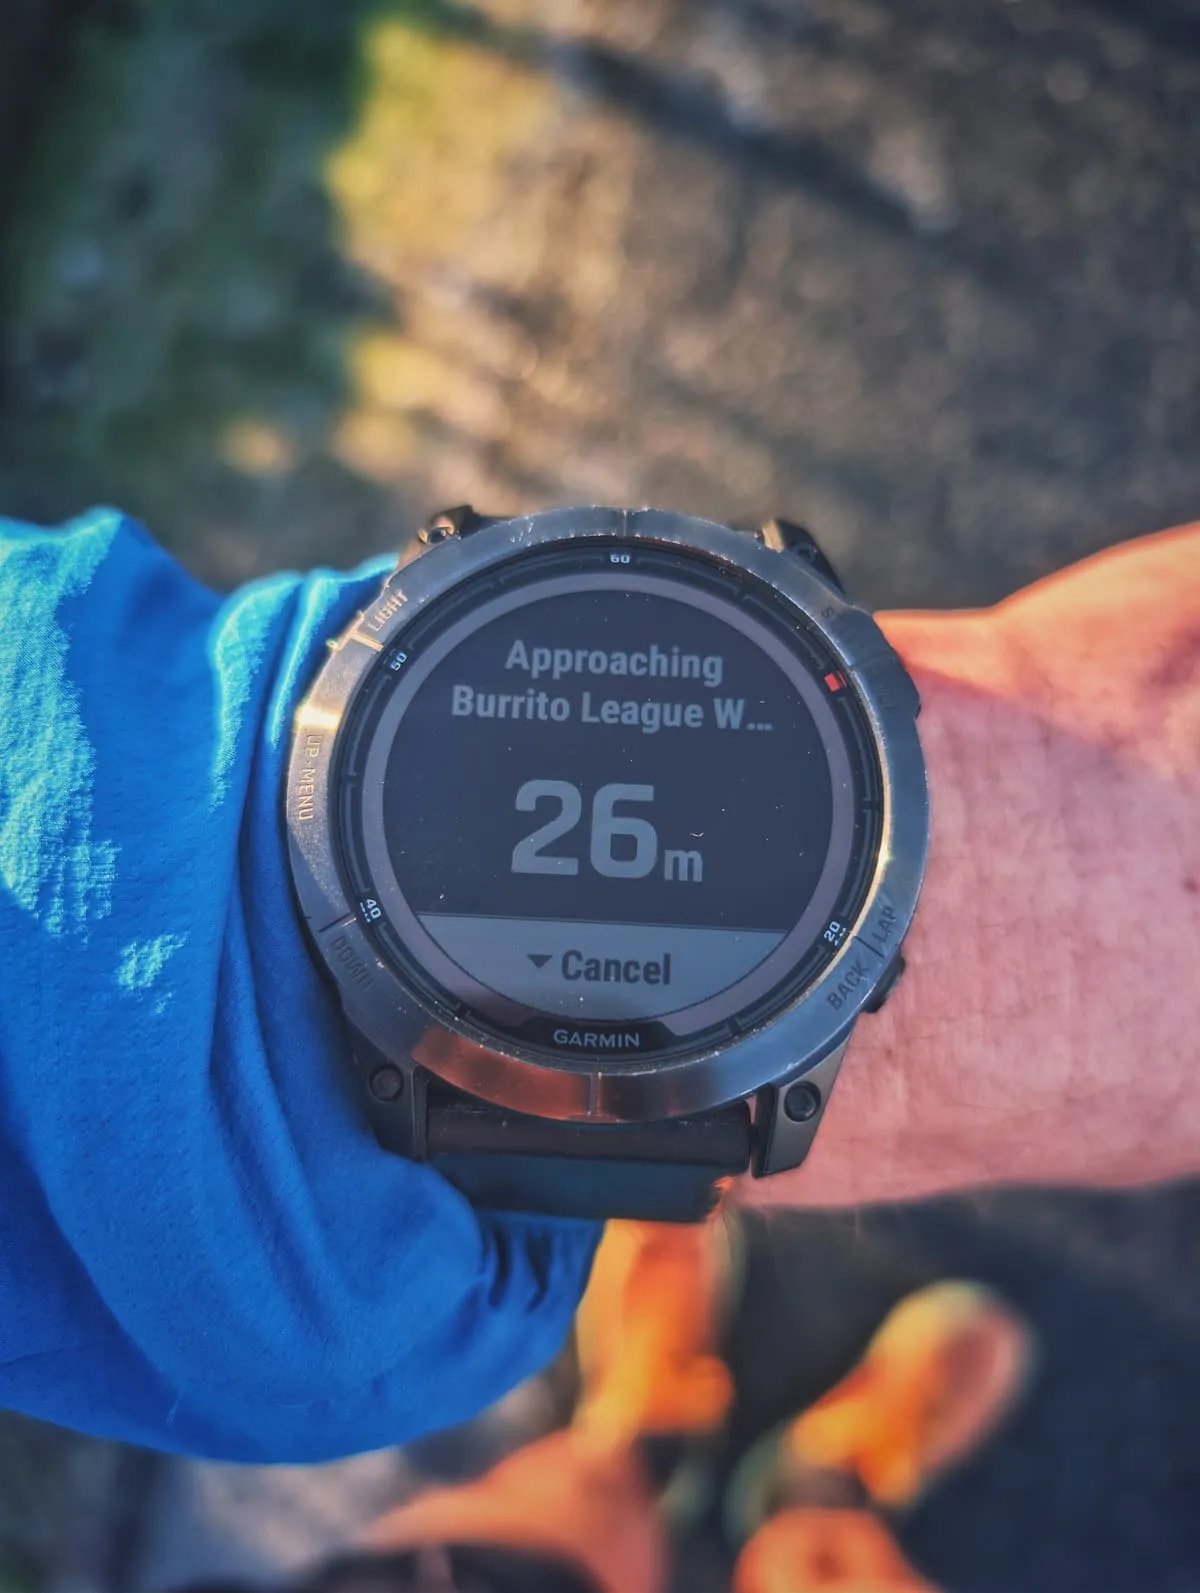
My recovery metrics didn’t look too fresh on Tuesday, so I decided to postpone the ultra attempt by one day to give the body a little more time. Instead I did ~16km of really easy Burrito League segments, just to get volume and gather some more data. I told myself that unless the body throws a tantrum overnight, I’m doing the ultra on Wednesday – and rest the rest of the week if needed.
I ended up executing on the ultra pretty solidly. I did the Burrito League segment in Colwood, 87x back and forth on a ~300m long stretch of urban road with ~1% gradient. Not the most inspiring, but it came with the benefits of having access to my car parked right on the road which I could treat as an aid station whenever I needed. I also avoided much vert. My original plan for January was a vert-heavy ultra, but coming back from illness and with a flight on Sunday I thought a controlled effort would be better and not put the next few weeks in jeopardy.
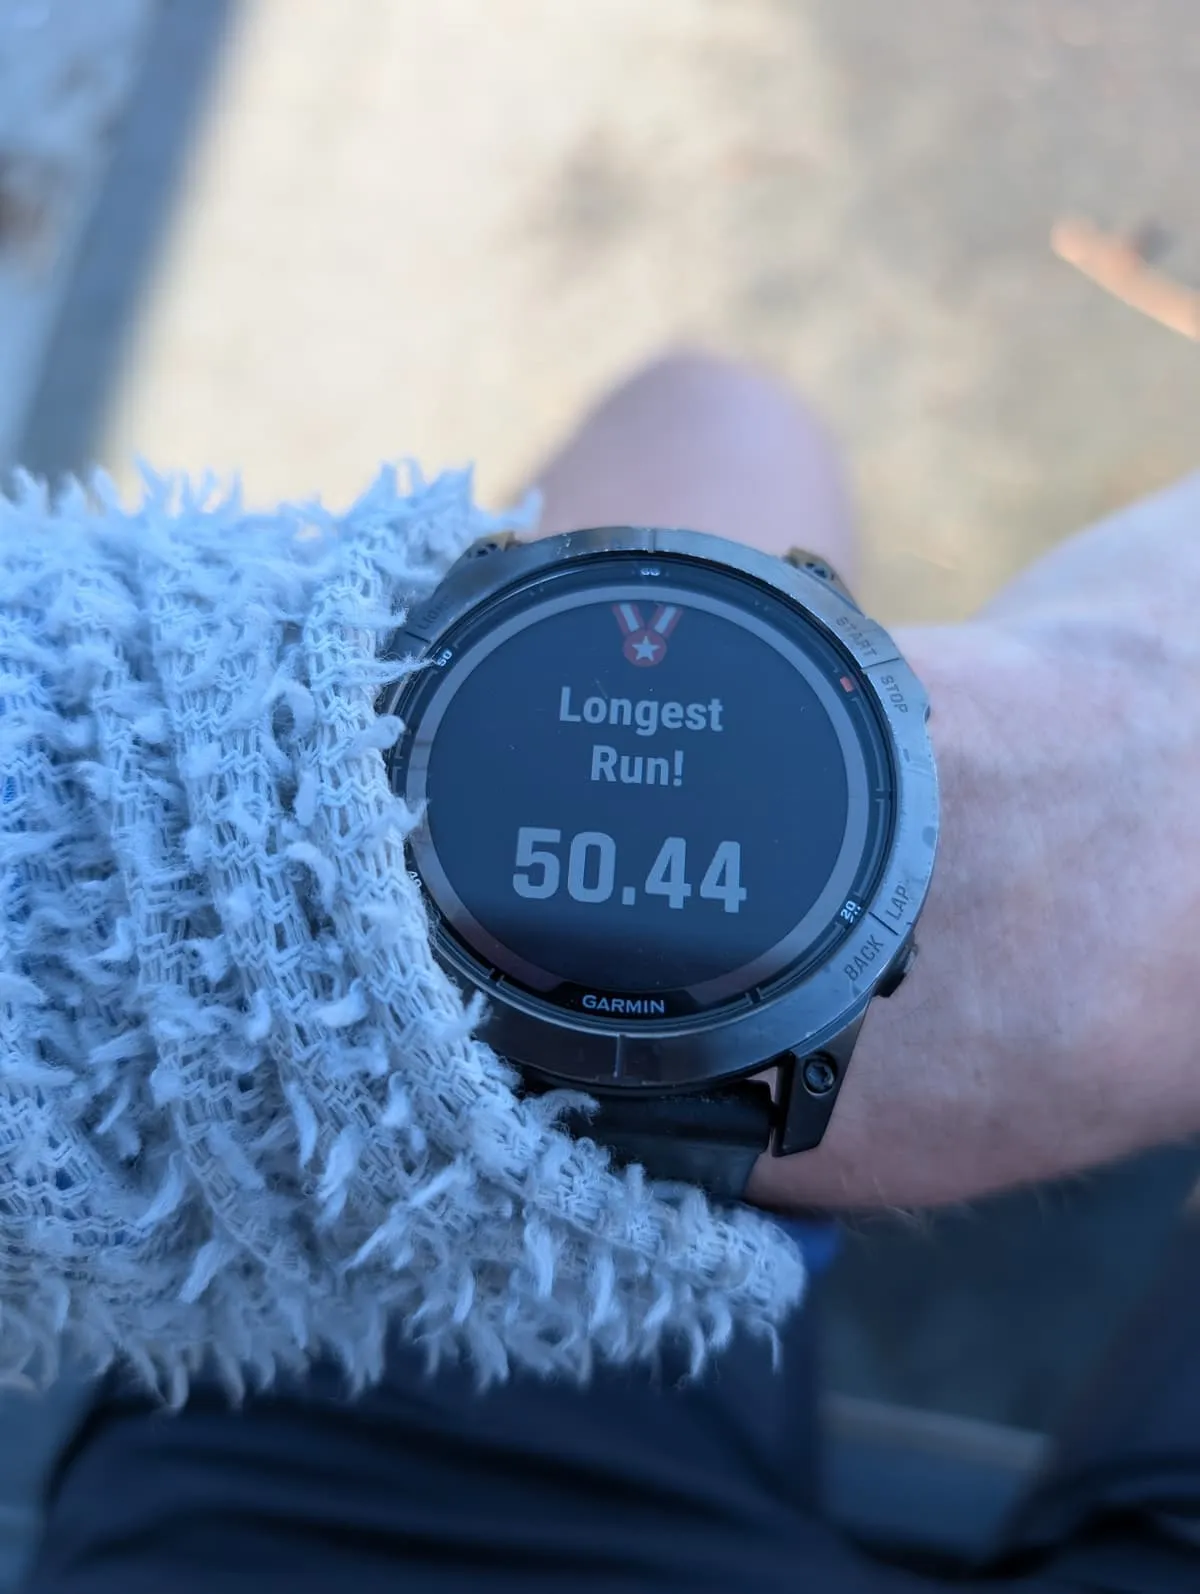
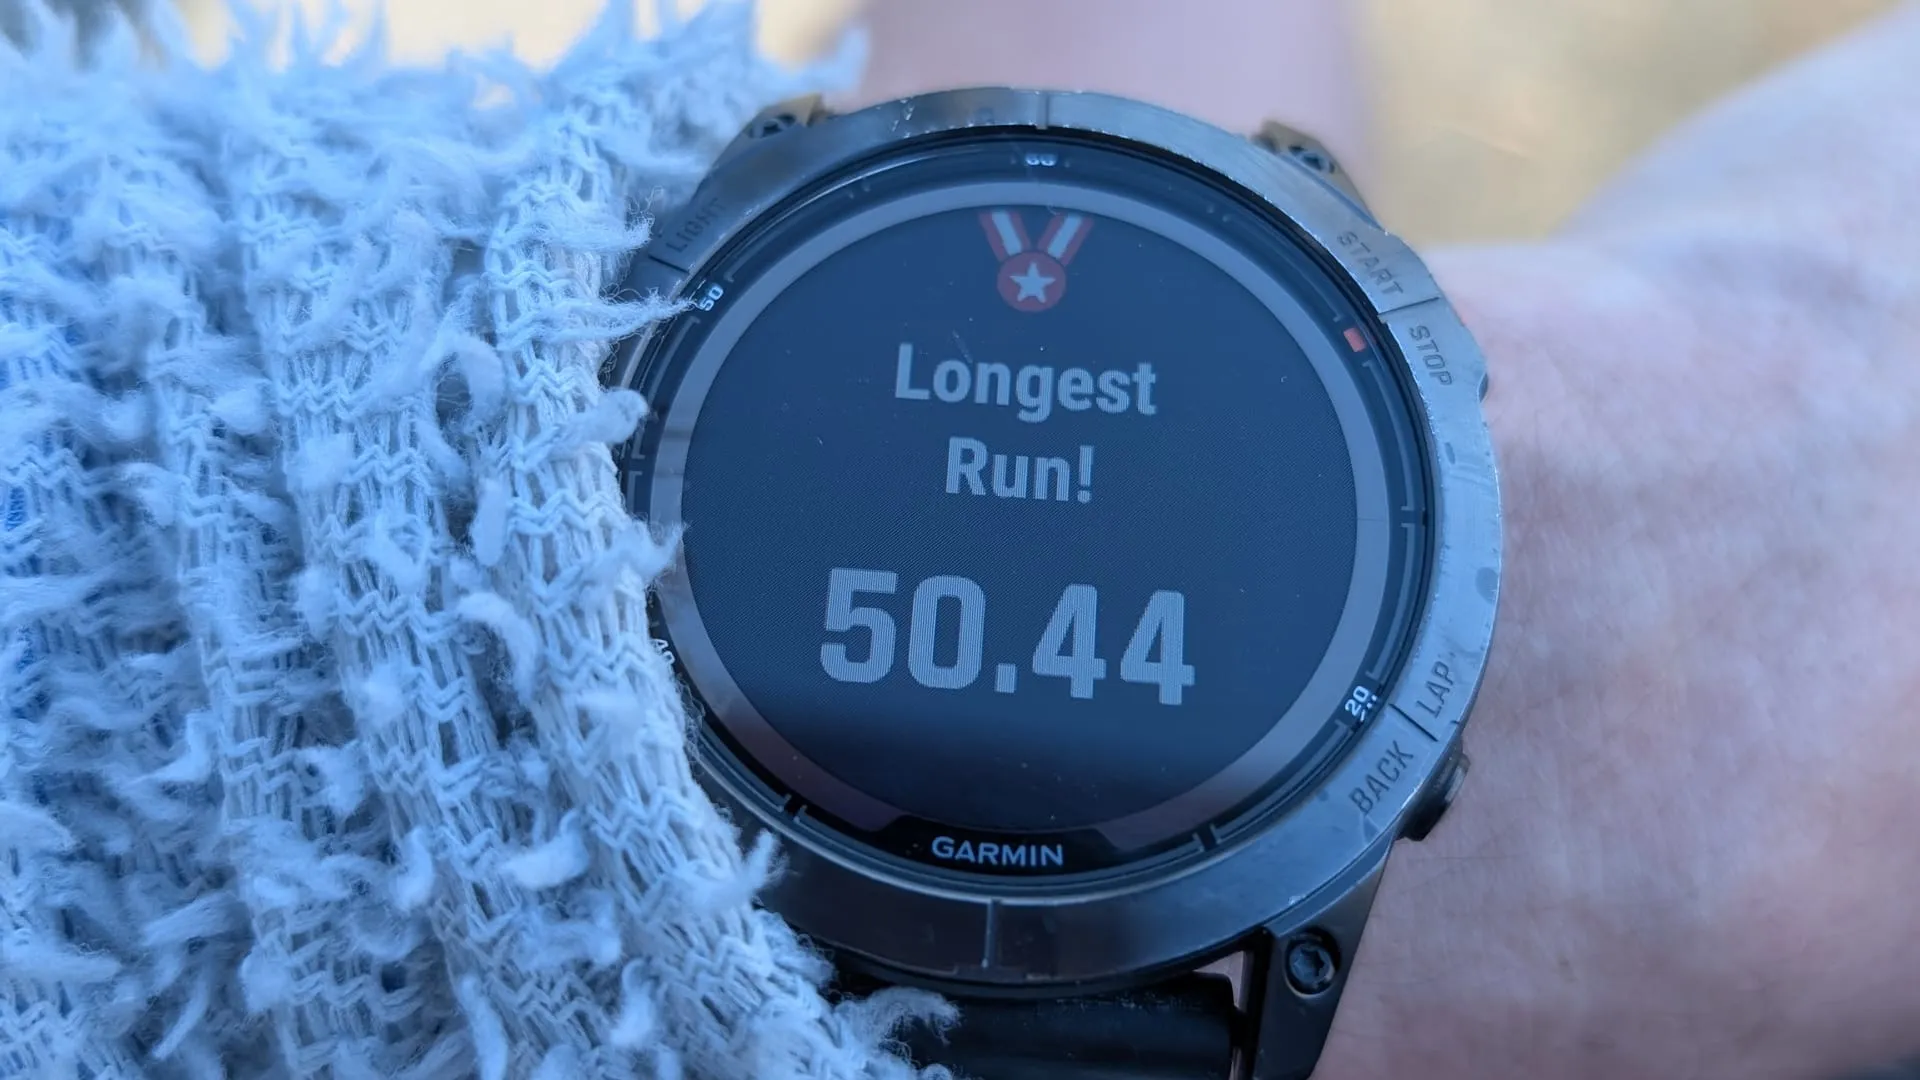
I went at an uncomfortably slow ultra endurance pace, 6:32 min/km GAP at 129 (!) BPM avg heart rate. Other than stopping for refueling and shoe changes three times (and two bio breaks) I ran for all of it. I completed my first ultra, and the longest I’ve been on feet since my Arizona Trail thru-hike in 2024.
Fuel and gear wise I treated it as a trail ultra. I kept a 30min fuel schedule. Every 30 minutes I had 1/3 of a 500ml bottle of water/40g of Tailwind plus 3 Cliff energy chew block pieces or a Kellog’s nutri grain bar (it’s what I had at home).
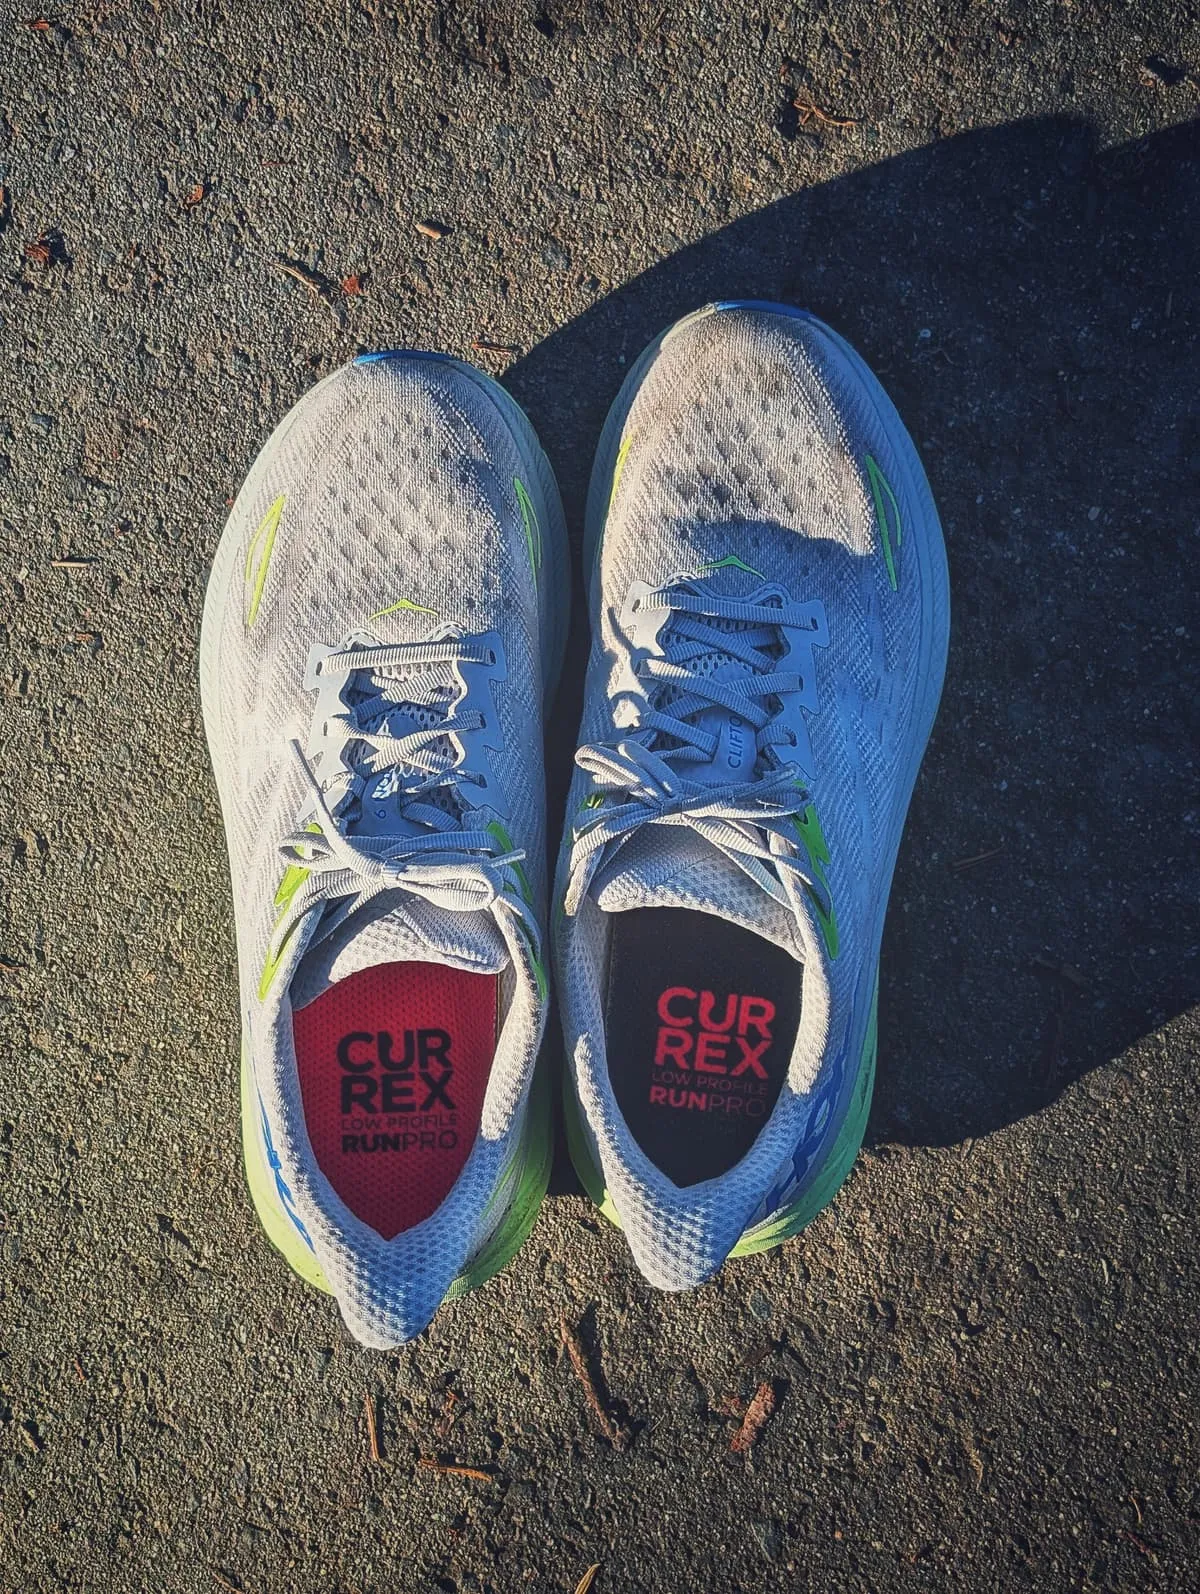
I started off in the Hoka Challenger 7 ATRs and Superfeet Med Arch to battle a knee niggle I think I got from running in stock insoles, I later switched into the Hoka Clifton 9s with Correx Run Pro Low. I’m not used to the sensation of changing shoes mid-activity, but it made me realize just how different the Challenges and Cliftons feel. I came away with just a little hot spot in the right arch, otherwise no issues other than fatigue (my right heel/plantar fascia did not complain at all!).
Made myself an ice bath that I endured for 15 minutes, shivered and couldn’t quite warm back up and took a warm shower 30 minutes later.
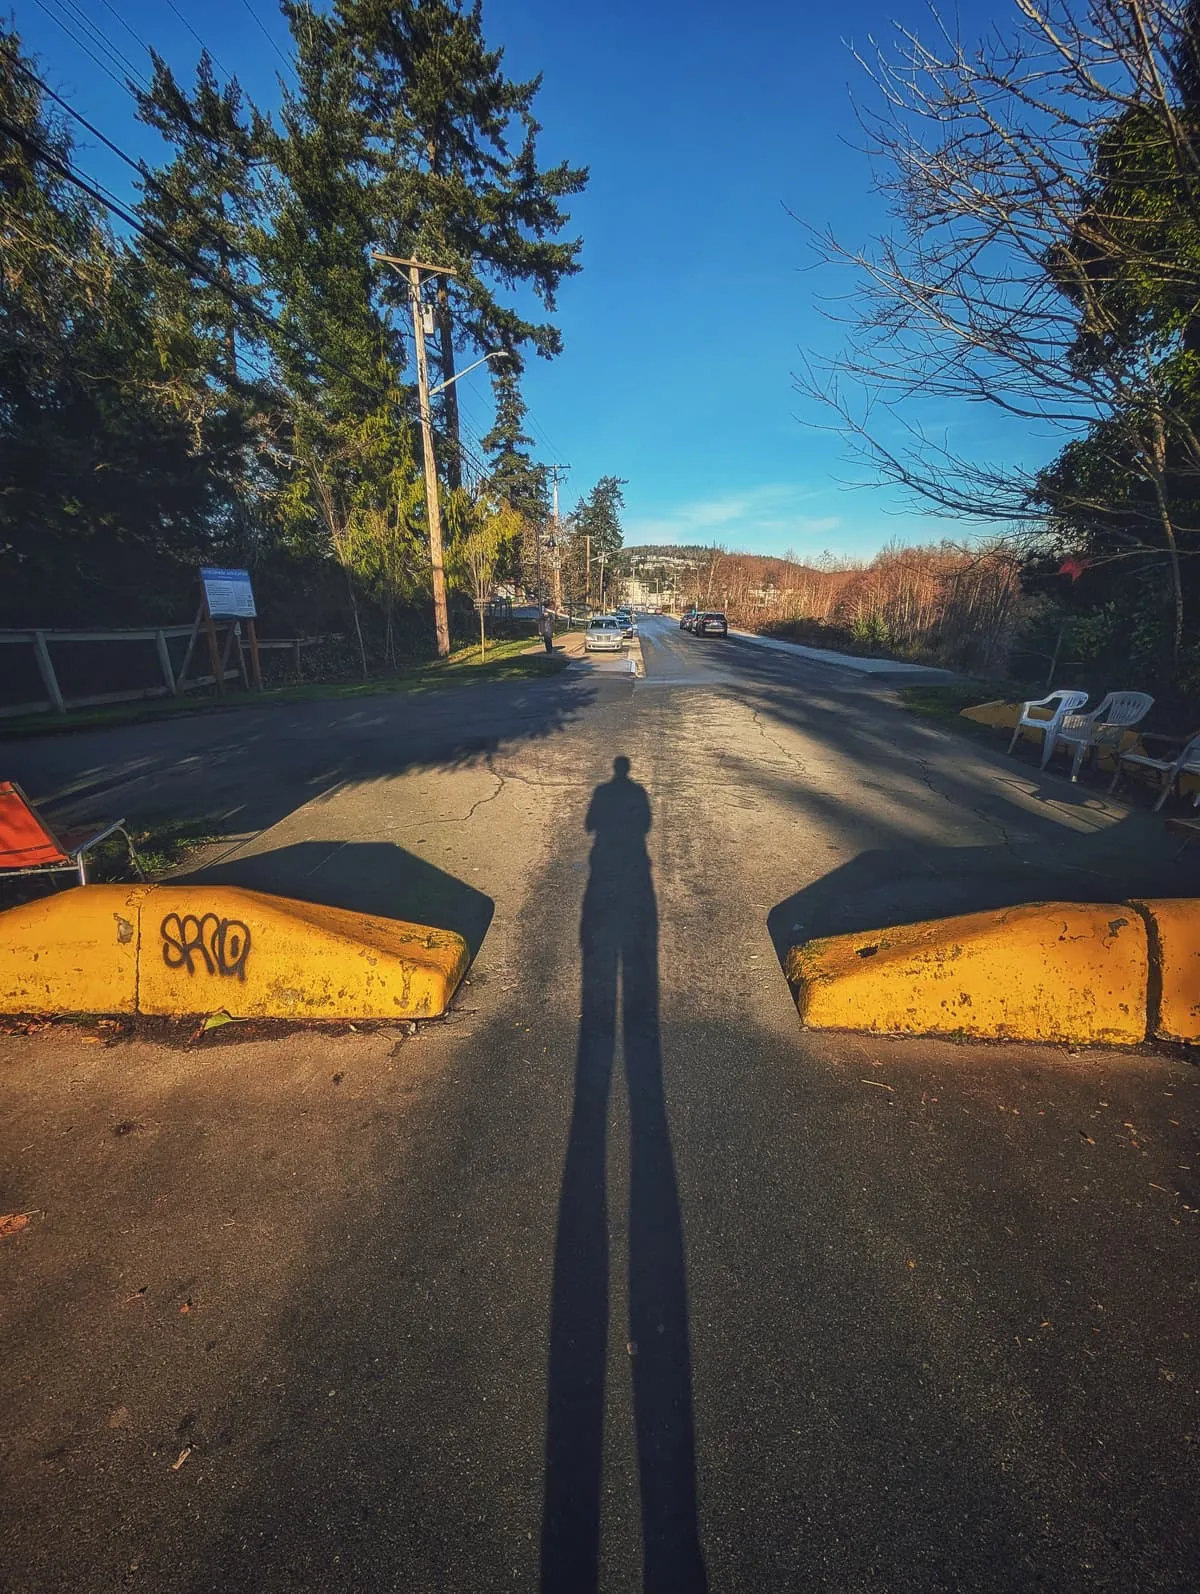
After a safety rest day I did another Royal Runs run to get some time in the forest before heading back to the Stockholm urban jungle for another month. I soaked it all up. I’m so thankful for having this playground just minutes from my house. Can’t wait to be back.
Analytics: Cardiac cost, drift, and durability
Outside of running I also worked to put more health and activity analytics in place. There will be more detailed blog posts on it, but wanted to share two examples.
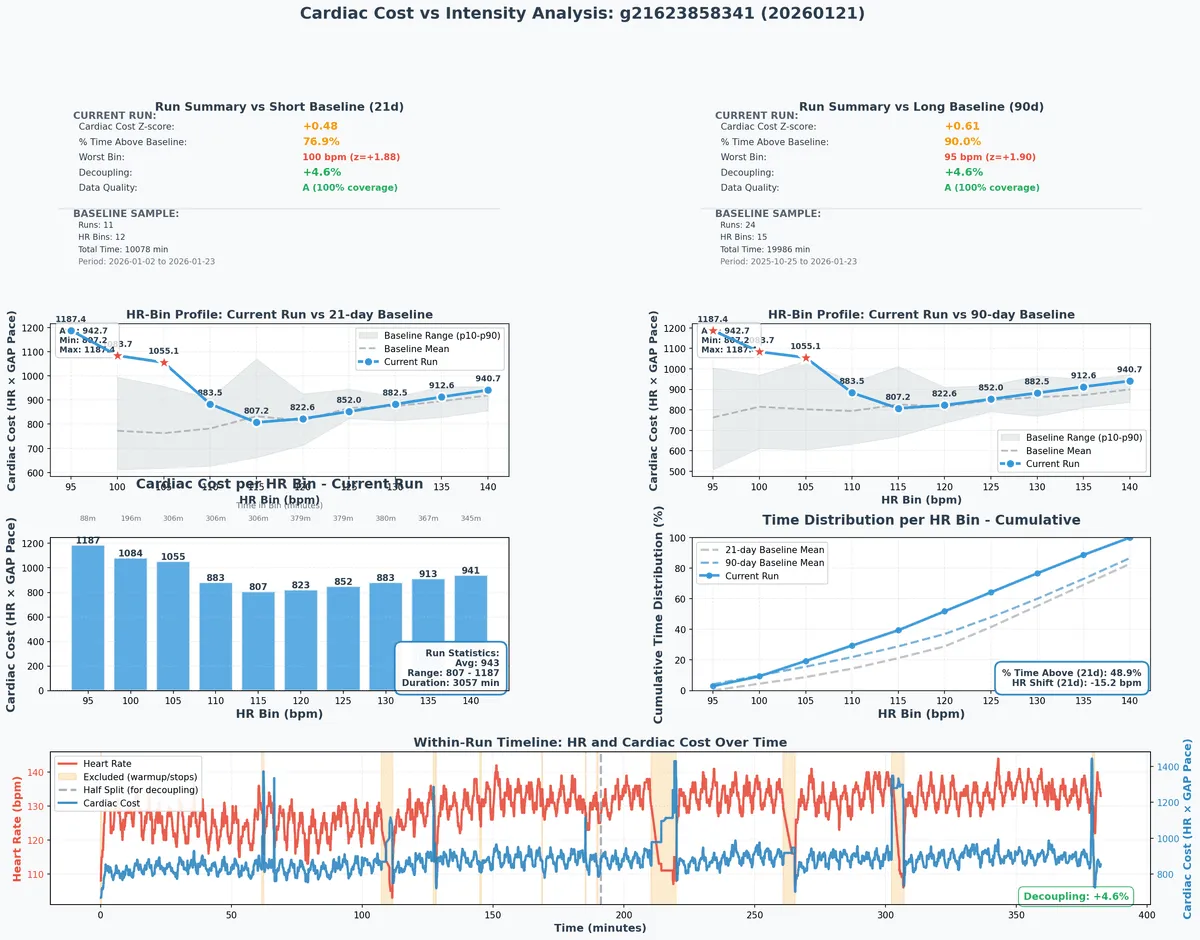
One is of cardiac cost for an activity normalized to GAP bins and benchmarked against historical distributions. It explores if a particular activity was executed more or less efficiently (from a cardiovascular perspective) compared to recent runs. At the end of the day there are many things that can impact the figures here, but to some extent it’s meant to tell me if my body is having to work harder than “normally”. Below is my 50k ultra as an example. There’s a few flaws and biases I’ll clean up eventually, such as the historical sample including both road runs and trail runs.
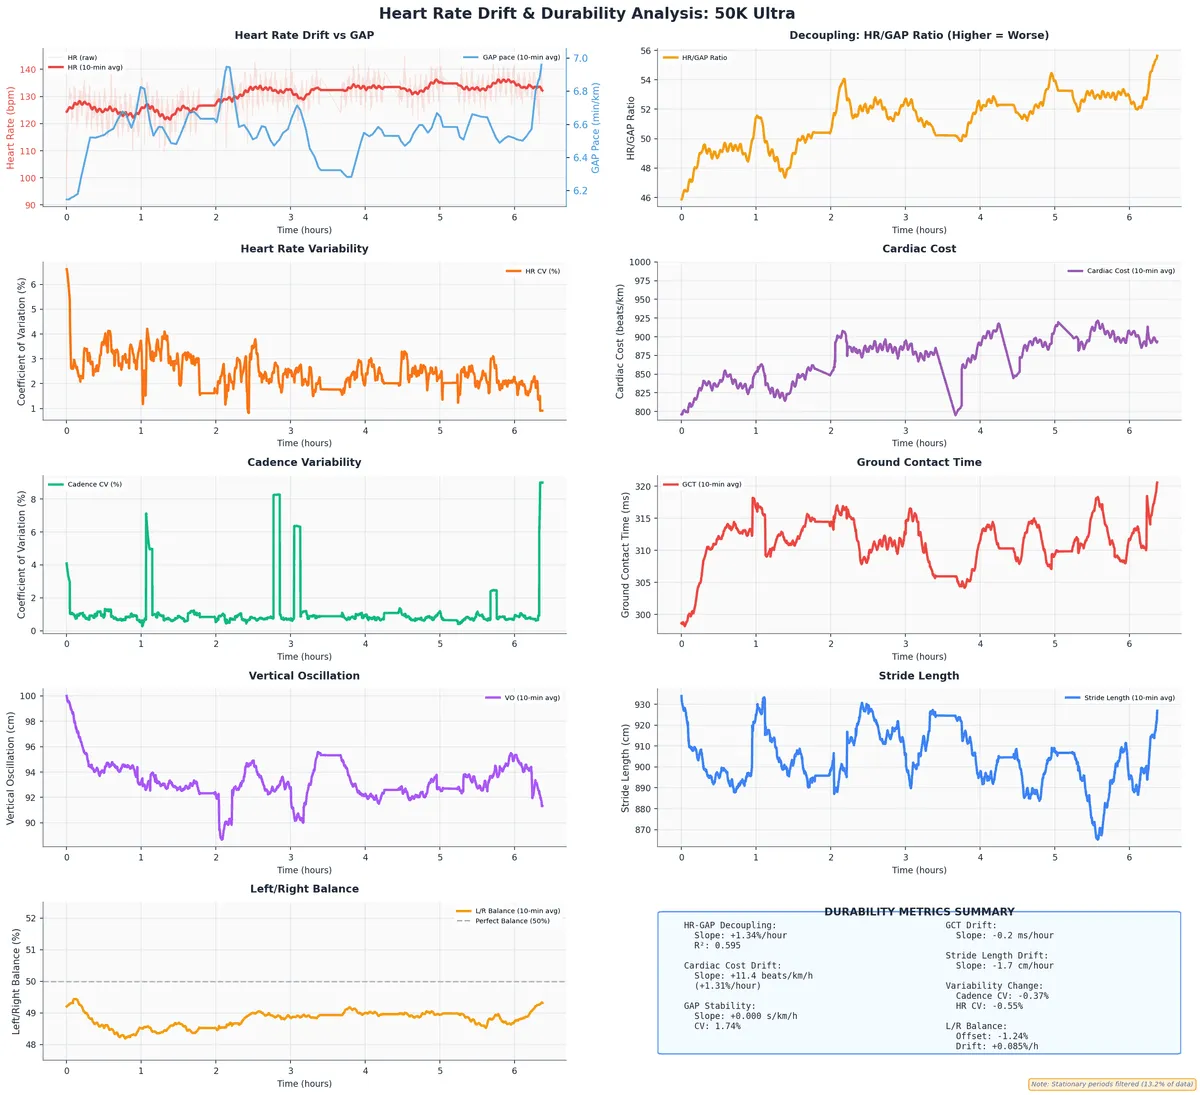
Next is drift and durability analysis that plots a few key metrics as time series for a given activity, and calculates if there’s changes/deterioration in them. The most common that would come to mind is heart rate drift (does your heart rate increase over time) and pace deterioration (are you running more slowly as you get tired). Again, I’m using the 50k ultra as the example. There is some deterioration across all metrics, but relatively small. This chart confirmed that I executed the run in a very controlled manner, and that I remained durable throughout. It’s a validation of how it felt.
Photos from the Week